
01
What it does
LC Analysis, GC Analysis, HRMS Analysis and Deconvolution are parts of the same program and open in the same window.
LC Analysis
Chromatograms from every detector in the run, such as PDA and UV, MS and RI, in one window. For MS data there are also the TIC, extracted ion chromatograms and mass spectra. Peaks can be integrated automatically or by hand.
GC Analysis
Agilent GC-MS runs with the TIC and the oven temperature. Peaks are integrated automatically, and the spectrum of each peak can be searched in your own libraries (MSP).
HRMS Analysis
Calibrate the mass axis, label exact masses, search molecular formulas and find polymer series. You can also look for one mass across all of its charge states.
Deconvolution
Turns the charge-state series of a protein into its mass, with Bayesian deconvolution, maximum entropy or IsoDec.
Compare
Puts the chromatograms or spectra of several runs on top of each other or in a stack, and lists the peak areas of each run.
Figures
Plots can be saved as PNG, TIFF, SVG or PDF at the width and text size a journal asks for.
Updates
Performance improvements are delivered regularly through updates.
02
Reports
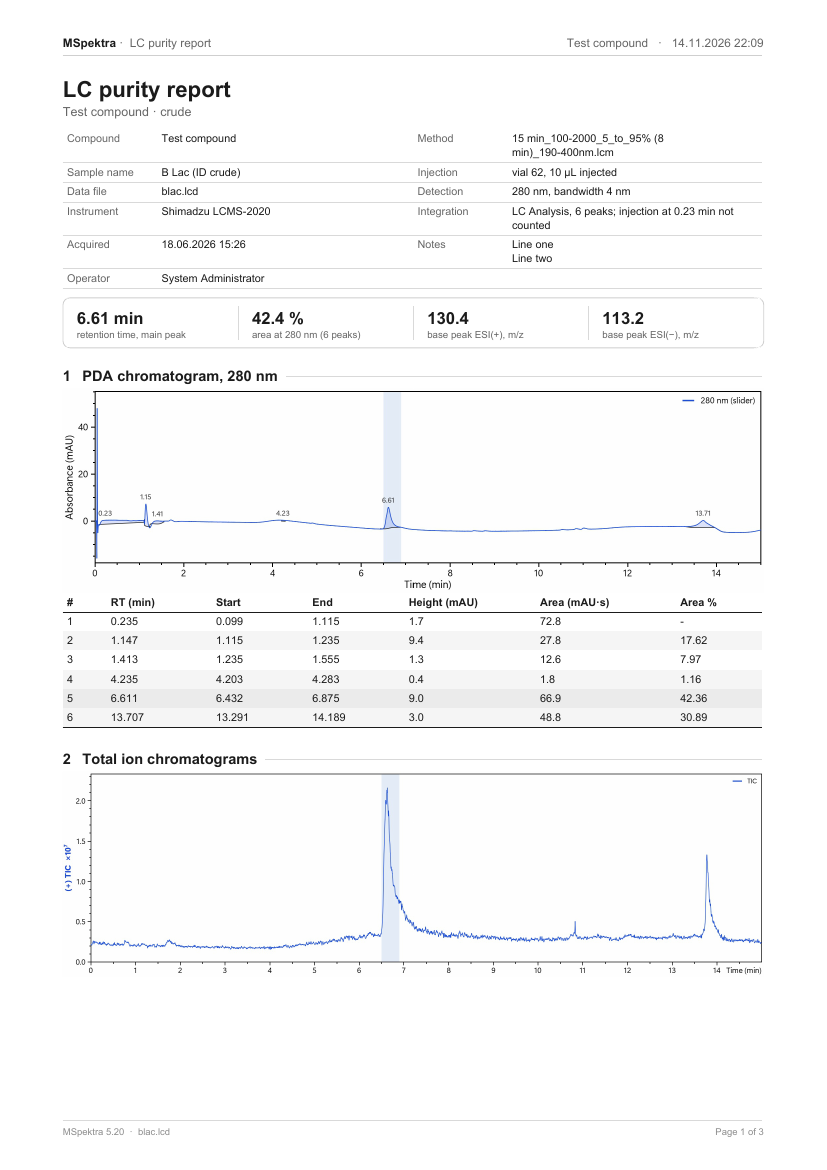
A report is made from the analysis on screen and saved as PDF or Word. For an HPLC or LC-MS run it holds the chromatogram, the integration table and the UV and mass spectra of the main peak.
Sample name, instrument, method and vial are read from the data file, so they do not have to be typed in. There are also reports for HRMS, deconvolution and comparisons, and supporting information pages for papers.
03
File formats
Vendor files open directly, without converting them first.
| Vendor | Files | LC | GC | HRMS |
|---|---|---|---|---|
| Shimadzu | .lcd | ✓ | – | – |
| Agilent | .D (ChemStation, MassHunter) | ✓ | ✓ | ✓ |
| Waters | .raw | ✓ | – | ✓ |
| Thermo | .raw (including Orbitrap) | ✓ | – | ✓ |
| Bruker | .d (including timsTOF) | – | – | ✓ |
| Open formats | .mzML, .mzXML, ANDI .cdf | ✓ | – | ✓ (mzML) |
| Spectra as text | .txt, or any mass spectrum opened in MSpektra | Deconvolute | ||
04
Download
MSpektra is free and open source under the MIT licence.
- Download
MSpektra-<version>.zipfrom the latest release. - Unzip it somewhere with a short path, such as the Desktop.
- Start
MSpektra.exe. There is no installer, and you do not need administrator rights.
Support
For questions, bugs or ideas, use Send feedback on the Home screen of MSpektra.
Citation
If MSpektra was useful for a paper, please cite it with the version you used:
The deconvolution is based on UniDec, so please cite that too: